Session 7
September 7, 2023
Agenda
- Manipulating strings with the
stringrpackage - Introducing regular expressions
- Combine two data sets into one with
*_join()functions
Cheatsheets
Resources
Content for session 7 will be based off of chapters 13 and 14 in the R4DS textbook.
Learning regular expressions (regex) is a bit challenging and therefore having good learning tools is important. The strings chapter the textbook is a good start, but I find it best to practice regex using interactive online tools. This link is a good resource and will teach you regex basics as well as let you practice interactively (I visit this site occasionally and learn something new every time): https://regexone.com
Several gamified versions of regex learning tools are available online. Here is a link to a collection of regex crossword puzzles.
Homework Exercises
What does
str_wrapdo? Can you show how it works by first creating a ggplot and giving it a long title?During the Thursday session I showed you have to use
$as way to specify the end of a string in regex. But what if you want to match a$character? For example, how do you remove the$in the string$1200. The answer can be found here. Usestr_replace()to give it a try.Go through the regex crossword tutorial found here (5 exercises) and then solve the beginner crosswords at https://regexcrossword.com/challenges/beginner.
When would you use
str_replace_all()instead ofstr_replace()?Install and load the
babynamespackage and use your data science skills to investigate a few different (at least two) naming trends over time. Below is an example where I look at the proportion of babies given a name starting with Ha (yes, as in Hasse) over the years.library(babynames) babynames %>% filter(str_detect(name, "^Ha")) %>% group_by(year) %>% summarise(prop_Ha = sum(prop)) %>% ggplot(aes(x = year, y = prop_Ha)) + geom_line() + theme_minimal() + labs(x = "Year", y = "Percent of babies", title = "Baby names beginning with Ha") + scale_y_continuous(labels = scales::percent)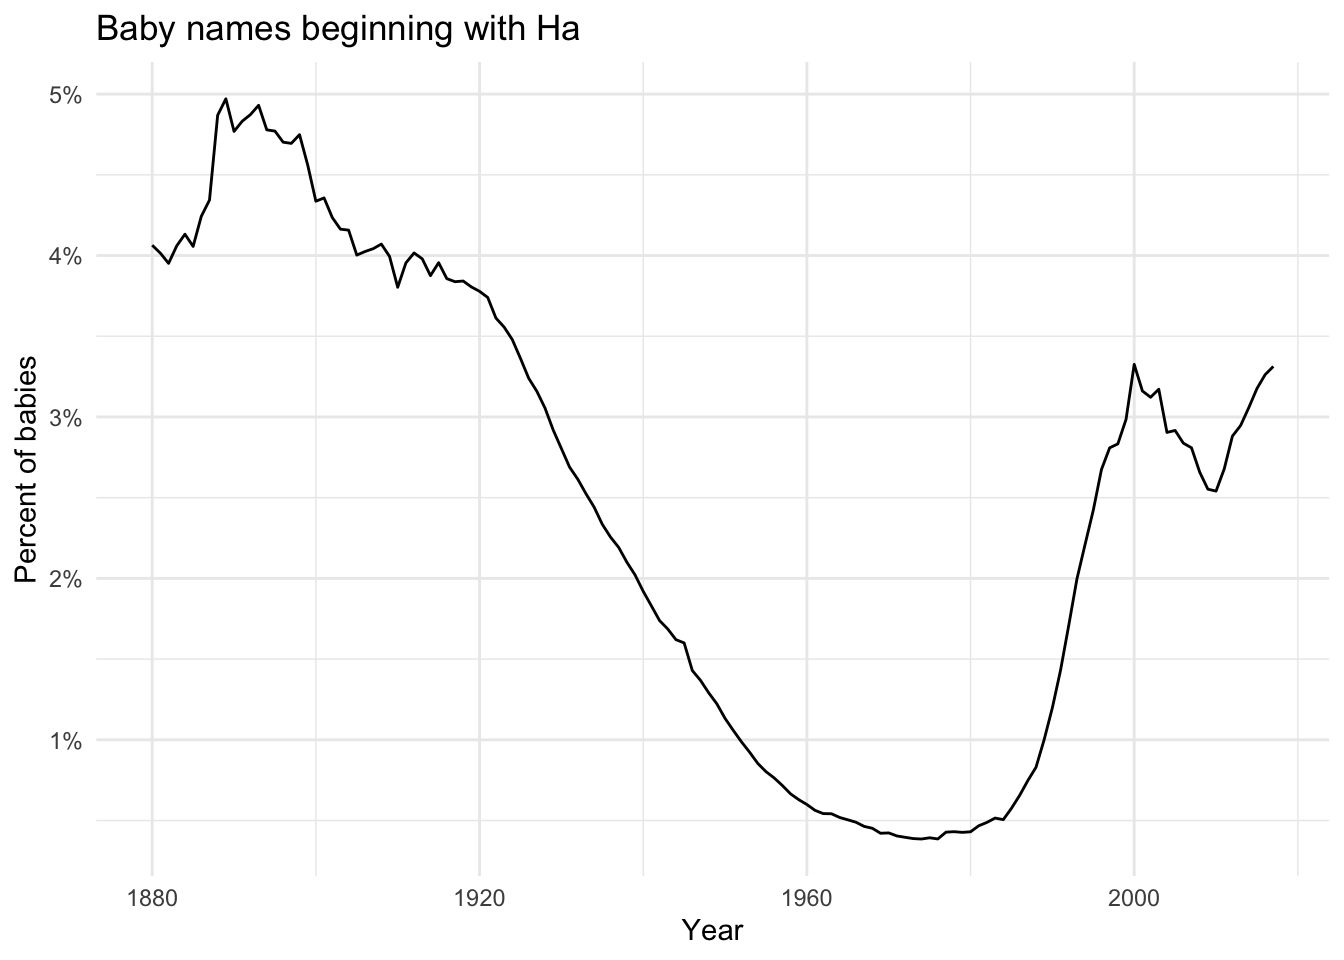
Copy and paste the tribbles below into your own script to answer the following three questions.
superheroes <- tibble::tribble(
       ~name, ~alignment,  ~gender,          ~publisher,
   "Magneto",      "bad",   "male",            "Marvel",
     "Storm",     "good", "female",            "Marvel",
  "Mystique",      "bad", "female",            "Marvel",
    "Batman",     "good",   "male",                "DC",
     "Joker",      "bad",   "male",                "DC",
  "Catwoman",      "bad", "female",                "DC",
   "Hellboy",     "good",   "male", "Dark Horse Comics"
  )

publisher_info <- tibble::tribble(
  ~publisher, ~yr_founded,
        "DC",       1934,
    "Marvel",       1939,
     "Image",       1992
  )
Merge the two datasets, keeping all observations from the
superheroesdataset.Merge the two datasets, keeping all observations from the
publisher_infodataset. How doesjoinhandle duplicate keys in this case?Merge the two datasets, ensuring that no observations are dropped.
Aiden and Sarah have given us a real data example from the imaging lab to practice string cleaning using the
stringrpackage. Out of an abundance of caution, the data will be sent via Slack instead of uploaded here, because the data includes real IDs. Your job is to do two things: first make edits so that all digit parts of the IDs are separated by the same type of character. Second, some IDs have a four digit time tag. Please remove this tag so that the IDs become more consistent.As we talked about during the Thursday session, the variables used to connect each pair of tables when joining are called keys. A key is a variable (or set of variables) that uniquely identifies an observation. In simple cases, a single variable is sufficient to identify an observation. In other cases, multiple variables may be needed (in the Cloudbuddy data for example, we need to use both
CloudbuddyandAge_in_daysto uniquely identify each observation). Find the keys in the following datasets:Lahman::Battingbabynames::babynamesnasaweather::atmosfueleconomy::vehiclesggplot2::diamonds
(You might need to install some packages and read some documentation)