Session 3
August 10, 2023
Agenda
- Data transformation using the
dplyrpackage - Pick observations by their values with
filter() - Pick variables by their names with
select() - Reorder rows using
arrange() - Introducing the pipe (
%>%) operator
Cheatsheets
Resources
Most of what we talk about this time will be based off of Chapter 5, sections 5.2 - 5.4 in the R4DS textbook. Chapter 18 gives more detail about the pipe.
Homework Exercises
The homework exercises for this week are below. Use the same data as last two weeks when working through the exercises. Make sure you use the keyboard shortcut (cmd+shift+m) every time you input the pipe.
Fix the code below so that it runs without error.
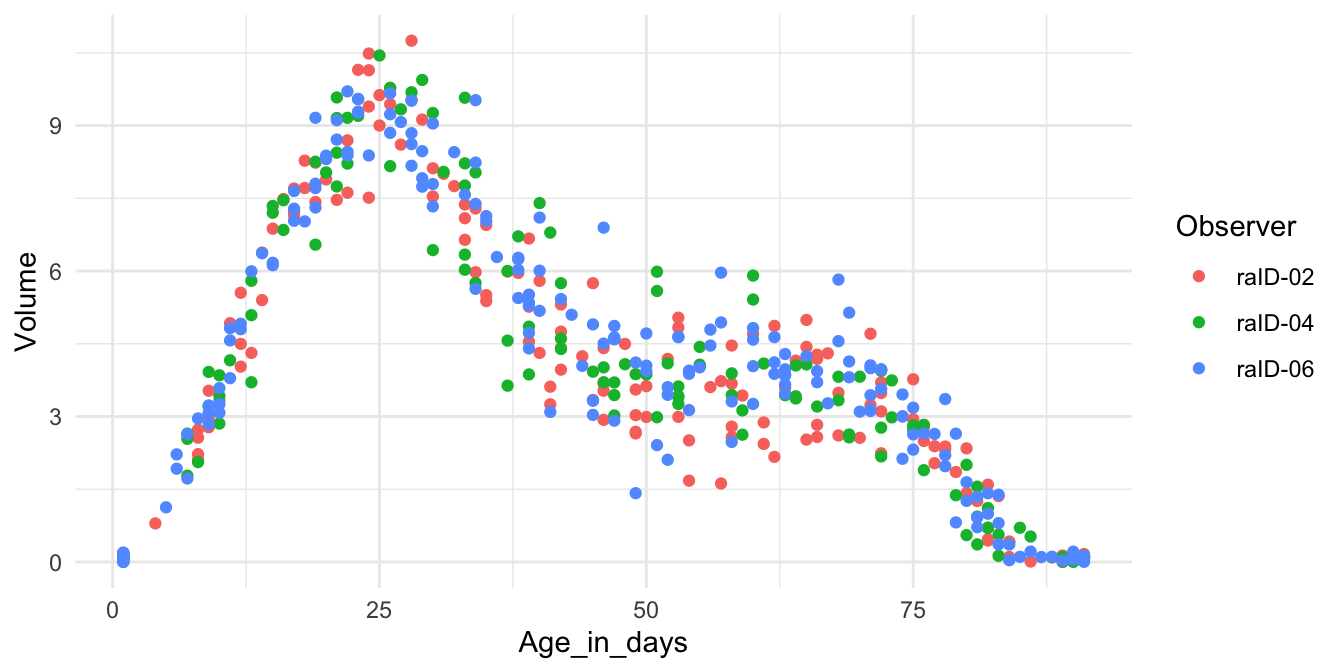
cb_data %>%
  filter(Cloudbuddy = "cbID-007")
Recreate the R code necessary to generate the plot below.
How many observations are there in
cb_datawhere the cloudbuddy Volume is less or equal to one.Use
arrange()to show how many cloudbuddies there are incb_data.Many times when working with data, we need to use multiple different functions to achieve the desired end goal. One option is to create intermediate objects for each step of the analysis process, as can be seen below. A better alternative is to use the pipe
%>%and link together different functions. Use the pipe method to convert the code below to a pipeline.cb_data_2 <- filter(cb_data, `Phase (color)` %in% c("1-lightgray", "6-red" )) cb_data_3 <- select(cb_data_2, `Phase (color)`, Volume) cb_data_4 <- arrange(cb_data_3, desc(Volume)) cb_data_5 <- rename(cb_data_4, Phase = `Phase (color)`) view(cb_data_5)Find all observations where the cloudbuddy Weight is more than ten times the Volume.
Run the code below and explain why the result looks the way it does. What would you change to achieve more meaningful output?
cb_data %>%
  filter(Observer == "raID-01",
         Observer == "raID-02")
How many observations have a Weight greater than 4 but less than 5.
Are there any observations in
cb_datawhere both Weight and Volume are missing? Can you find the answer in more than one way?Find the youngest age for which Volume is greater than 6. Does it matter what order you use the functions?
Run the code below. Does the result surprise you? How do the select helpers deal with upper and lower case by default? How can you change that default?
cb_data %>%
  select(contains("DAYS"))
Select all numeric columns in
cb_datausing at least three different ways.Create an analysis pipeline that first picks the first five cloudbuddies (based on how cloudbuddies are numbered) and the last three phases, then changes the
Age_in_daysvariable name toAge, then orders the data byWeight(ascending order), then selects theAge,WeightandPhase (color)columns, and finally shows the data usingview().